
GIVENERGY SOLUTION
The kitchen is one of the highest energy usage areas in the home, and required the most monitoring devices and also a central control panel to monitor and control the energy usage.
- 12 x 360w Solar Panels
- 1 x GivEnergy Gen 1 3.6Kw Inverter
- 2 x 9.5Kw Gen 2 Li-ion Batteries
PRODUCTS
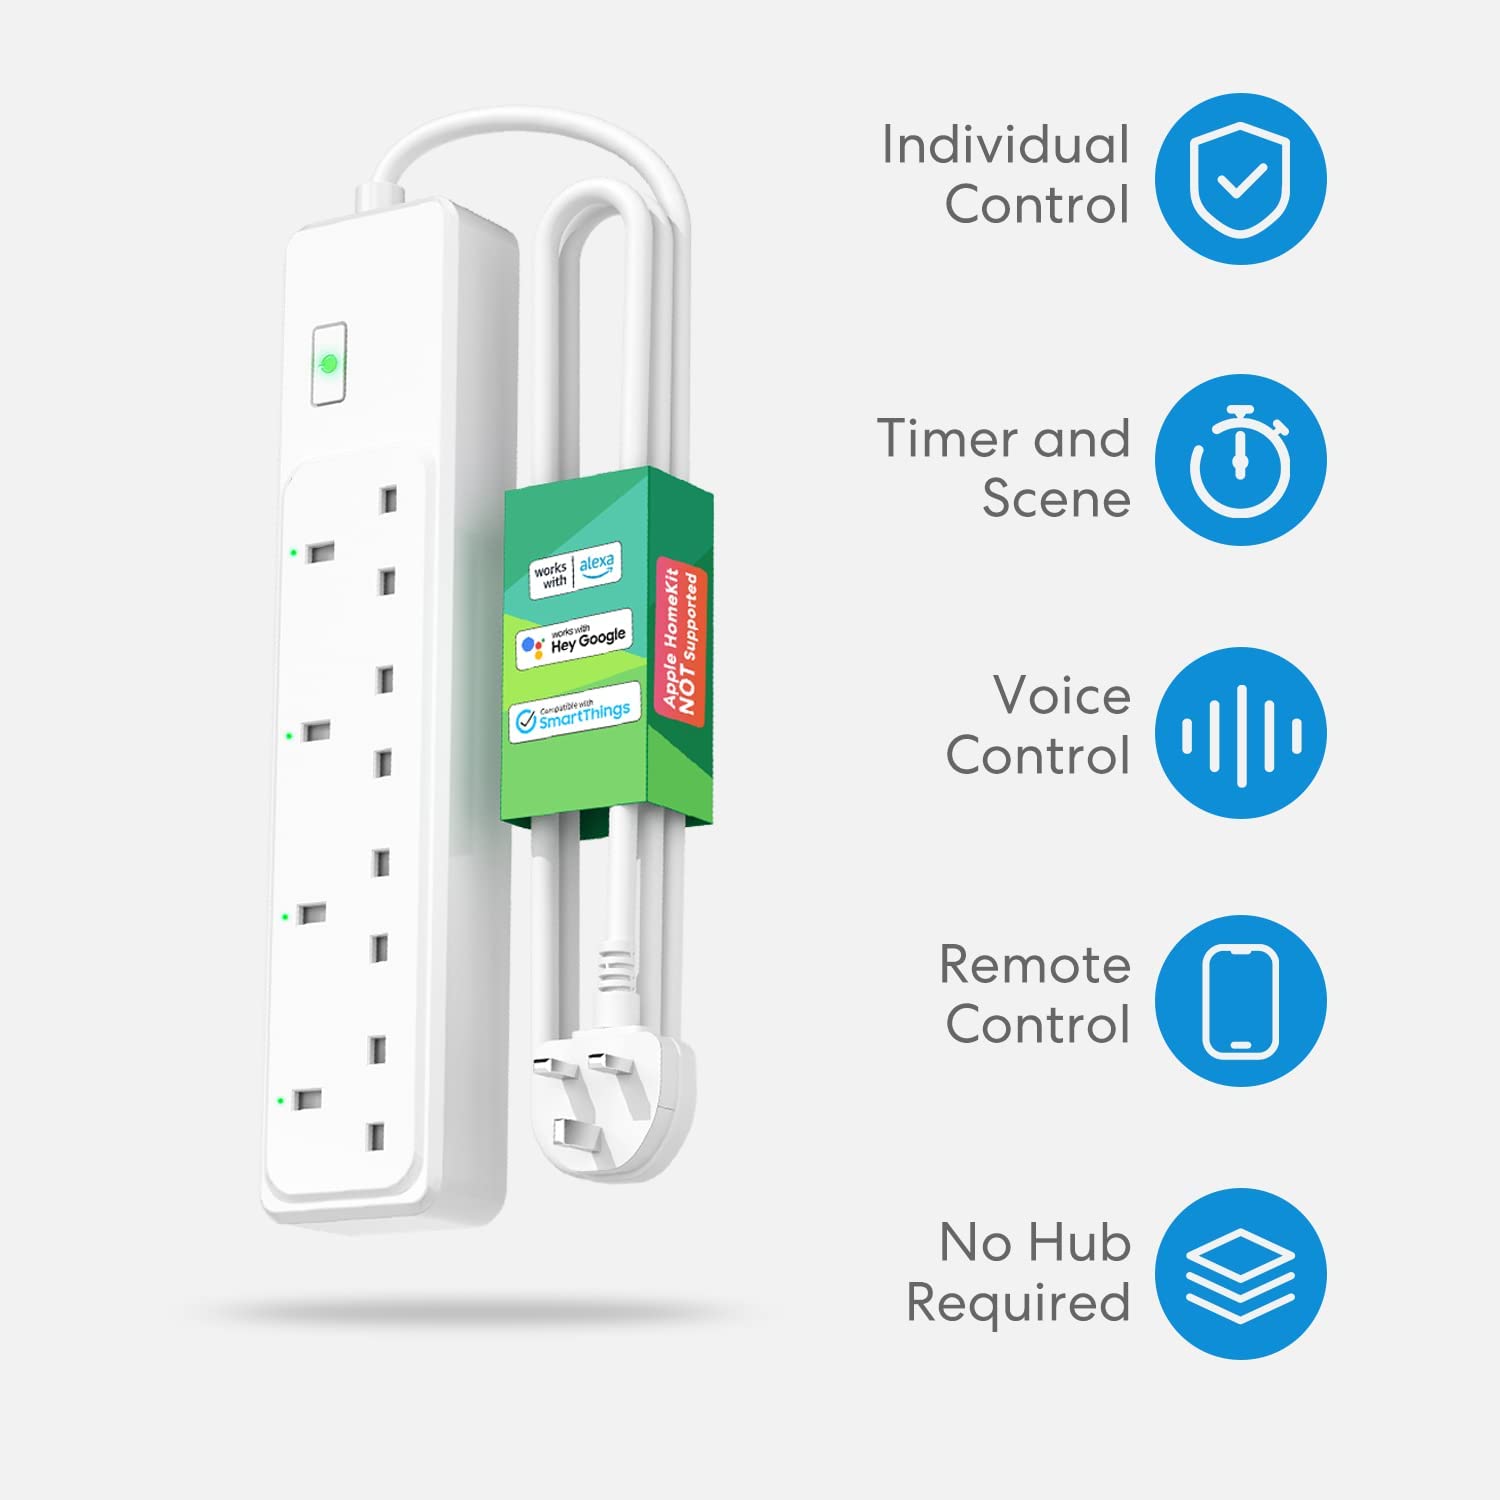
Meross WiFi smart plug with 4 A/C outlets
I have 2 of these devices connected to my entertainment area to control:
Meross 4 Gang (1)
- Kitchen Echo
- Reolink CCTV PTZ Camera
- Cooker Hood
- Amazon Fire Tablet (Home Assistant Control Panel)
Meross 4 Gang (2)
- POE Switch
- Reolink CCTV PTZ Camera
- Deco M5 WiFi Access Point
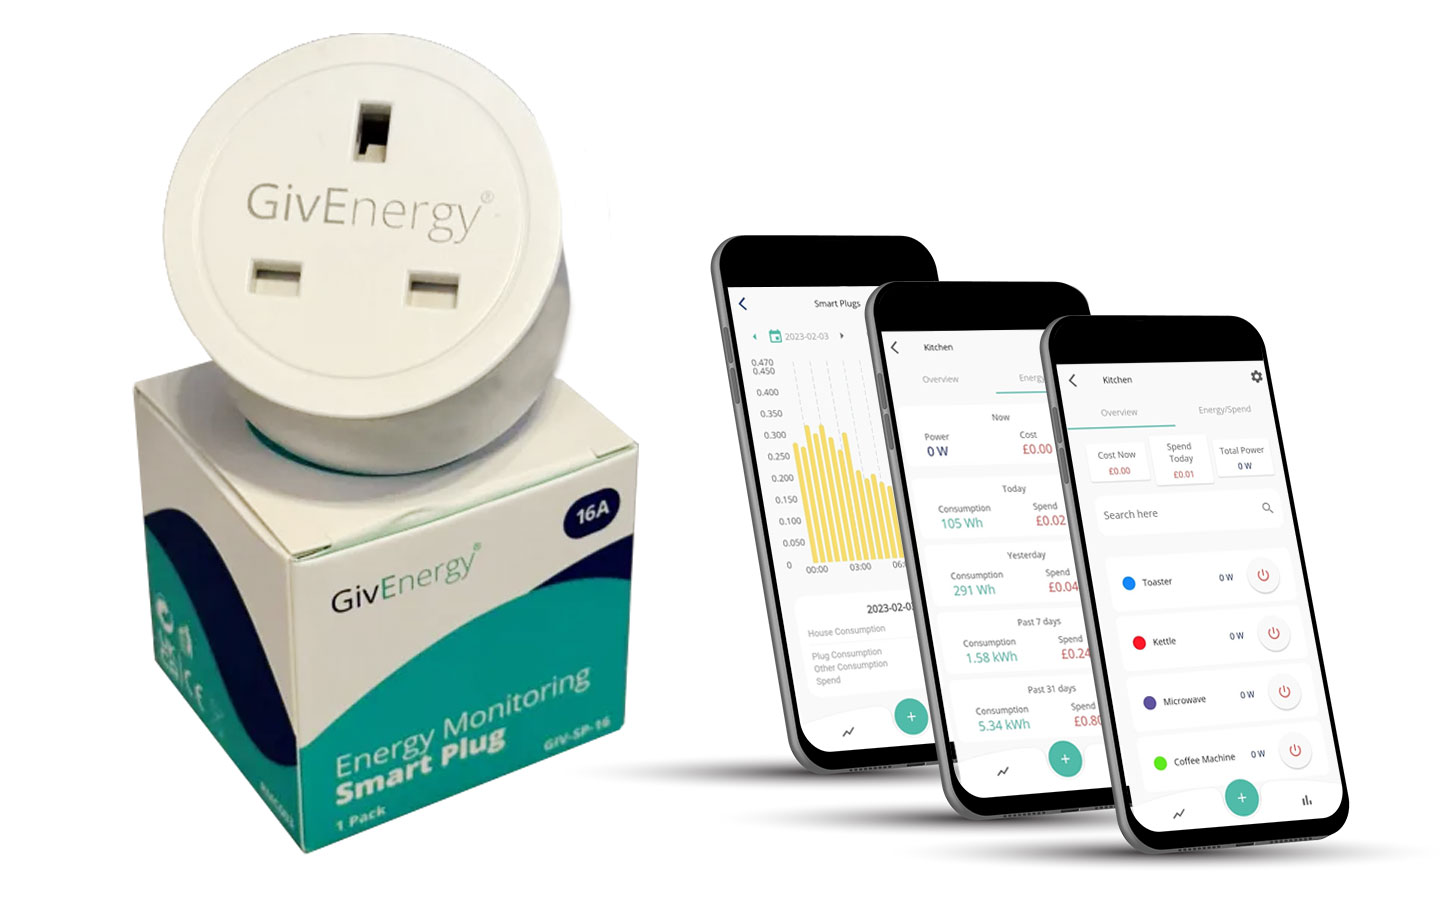
GivEnergy Power Monitoring Smart Plug
They provide the usual features of being able to remotly turn appliances on and off via the app or alexa voice control as well as being integrated into the mobile app to provide detailed energy information.
I have GivEnergy smart plugs connected to:
- Kettle
- Coffee Machine
- Microwave
- Toaster
They are used for remote (power) control of the connected devices as well as providing energy monitoring statistics via the GivEnergy App.

Kitchen Dashboard
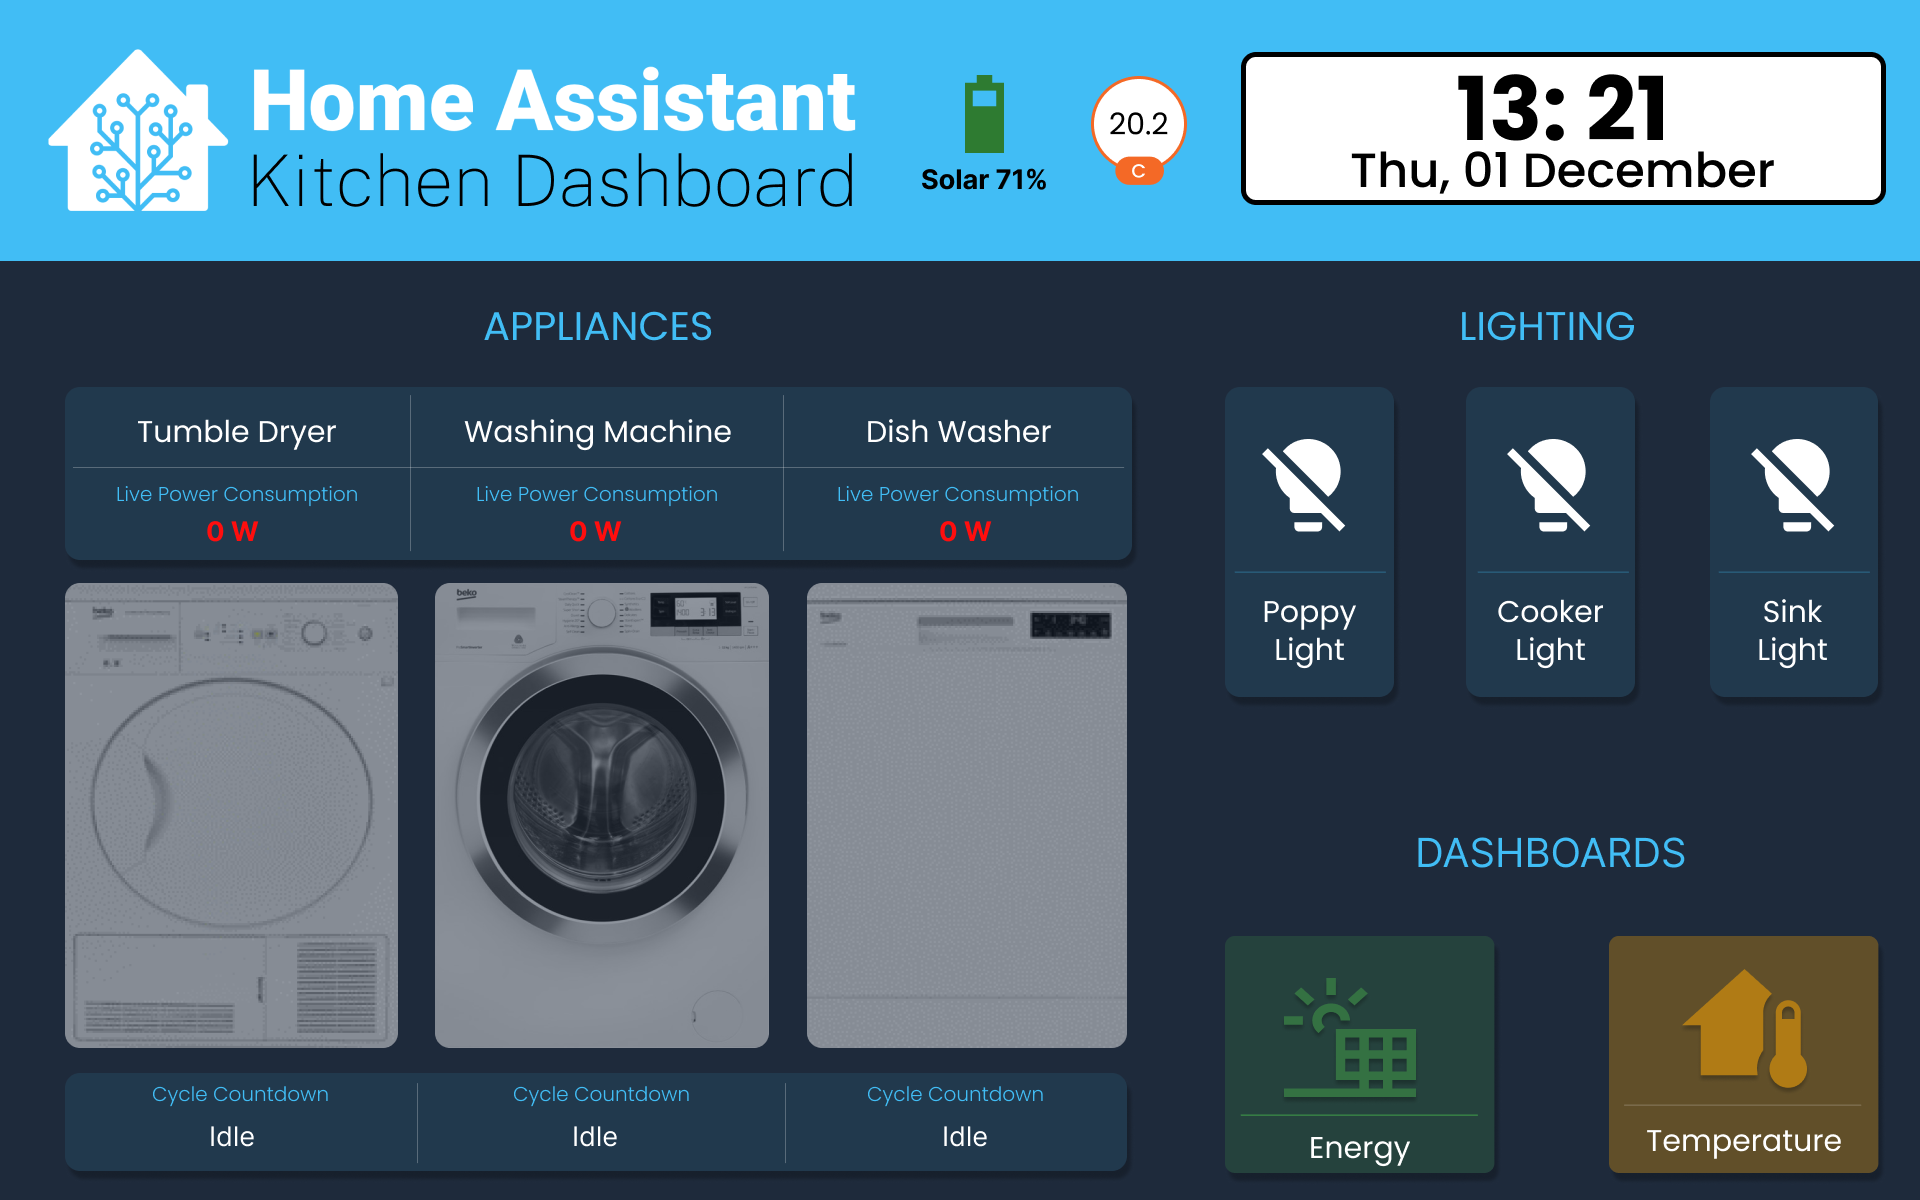
The dashboard was designed in Figma and saved as an image and imported into Home Assistant where the data that was available from smart devices was overlayed onto the image for dynamic updates.
APPLIANCES
The main appliances (Tumble Dryer, Washing Machine & Dishwasher) are set to turn on and off by touching the appliance image.
Once the appliance is selected and powered on, a timer starts to count down before (shown under the appliance) turning off automatically at the expiry of the timer. At the same time, the Live Power Consumption is displayed to give up to the second readings of how many watts are being consumed by the appliance.
LIGHTING
Instead of using the switches on the wall to turn on either the left side of the kitchen lights (10 lights) or the right side of the kitcen lights (8 lights) I setup the option to only chose the lights necessary to provide light on what was needed.
DASHBOARDS
The final section shows the other dashboards available to switch to to get information on that particualar dashboard.
Temperature Dashboard

The dashboard was designed in Figma and saved as an image and imported into Home Assistant where the data that was available from smart devices was overlayed onto the image for dynamic updates.
SmartBot temperature and humidy sensors have been placed in every room in the house to monitor the temperature of each location.
This was setup to monitor the home during the winter months to investigate if there were any issues with the house leaking heat and therefore wasting energy and money.
The temperature sensors provide a live update of the current temperatures as well as being selectable so you can review the history of the temperatures over time.
Humidity Dashboard

The dashboard was designed in Figma and saved as an image and imported into Home Assistant where the data that was available from smart devices was overlayed onto the image for dynamic updates.
SmartBot humidy sensors have been placed in every room in the house to monitor the humidity level of each location.
This was setup to monitor the home during the winter months to investigate if there were any issues with the house suffering from excess humidity which can lead to damp and mould.
The humidity sensors provide a live update of the current levels of humidity as well as being selectable so you can review the history of the readings over time.
GivEnergy Dashboard

The dashboard was designed in Figma and saved as an image and imported into Home Assistant where the data that was available from the GivEnergy GIVTCP API was overlayed onto the image for dynamic updates.
We have recently installed a GivEnergy solar solution which consisted of 12 solar panels and 2 batteries.
While the solution has its own dashboard, important information is scatterd across several screens and takes time to gather usful information quickly. I therefore created my own quick view dashboard which displays important information on one screen for glancing.
It displays:
- the current temperature of the Inverter and each battery.
- the current amount of energy being produced by the solar panels both combines and per string.
- the current charge for each battery along with a combined charge which is available to the house.
- how much solar has been produced today (kWh) and how much was consumed by the house.
It also displays a live energy flow informing how much the house has used and where the energy is coming from (solar/grid) in real time.
I also added some extra data to show how much the house is using of the battery, how much is going from solar to the battery / house and house is using in terms of energy.